

RELATED ARTICLES
SHARE ARTICLE
Kubernetes Weak Points: Understanding Your Cluster's Weakness through Data
Learning Objectives
- Understand CPU limits
- See how DNS issues can cause latency and errors
- See the impact of targeted crypto attacks on Kubernetes clusters
Kubernetes is a powerful system for orchestrating containers and managing infrastructure for cloud-native applications. However, it is also a complex system that is prone to vulnerabilities and failures. When problems occur, organizations must have a robust monitoring setup in place to be able to identify, triage, and resolve incidents. This article will introduce several problems that organizations have faced while running Kubernetes in production, and it will also explain how they resolved them.
CPU Limits That Aren’t Actually Helpful
CPU limits are recommended to ensure no single service hogs resources in a K8s cluster. However, they can sometimes cause other issues.
Eric Khun has explained how Buffer overcame latency issues that they encountered while running Kubernetes. In this case, Kubernetes was automatically throttling services that seemed to consume too much CPU time. Buffer realized that limiting CPU is a Kubernetes best practice, and that this is intended to prevent any single service from hogging all available CPU time. However, they found that many services were being throttled even though they weren’t anywhere near the CPU limits. This, it turned out, was a result of a Linux kernel bug.

What’s important to note here is that Buffer found this issue by keeping track of the throttling metric. If throttling occurs in a one-off case, that’s acceptable. However, if too many containers are being throttled, it will most likely result in latency.
To solve this problem, Buffer decided to disable CPU limits on those services that were being throttled, and to carefully isolate those services by placing them on separate tainted nodes. This helped to protect other services that were still bound by the CPU limits. After the change, they saw a remarkable drop in latency across all services.
Omio encountered issues with latency as well, and they shed some new light on the way in which CPU resources are calculated in Kubernetes though their resolution process. As Fayiz Musthafa has explained, Omio found that these resources are calculated based on the usage time rather than the power of the CPU. This means that the usage time is split evenly across all services, even if a lot of CPU power is available, and this results in each service getting only a small part of the CPU’s resources. Omio found that it is much easier to track memory-related throttles than CPU-related throttle, and they analyzed the nr_periods, nr_throttled, and throttled_time metrics to understand the throttle rate of CPU requests.
DNS Issues Causing Latency and Errors
Networking is complex with K8s, and often DNS can be a particularly prickly part of K8s networking.
Galo Navarro has written about DNS issues that they faced when migrating a microservice from EC2 to Kubernetes. According to their blog, they first noticed that their latency was 10X greater than it was before, and they started to gather metrics from Zuul (a Netflix-created open source tool for routing, filtering, and more), EC2, Nginx, and Kubernetes to find out what was causing this problem. After they ruled out issues related to JVM and containers, they began to suspect that there was an issue with network calls – either DNS resolution issues or rogue calls to AWS. Then, they zeroed in on DNS queries from a container to a specific domain and dug deeper to view the entire request path.
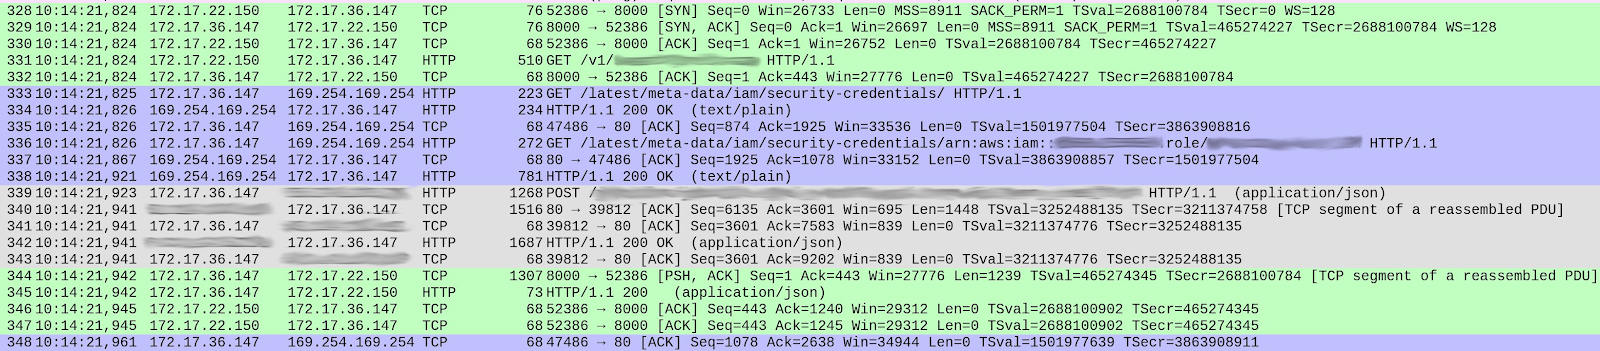
When the organization examined the different TCP streams, they were able to identify the packet where latency was occurring. (The streams are color-coded in the image above, and the ones that are highlighted in blue show the most latency.) They were then able to trace the problem to queries made to the AWS instance metadata. In this case, the latency was caused by different credential defaults in KIAM and the AWS Java SDK. To discover this, they had to look at different data points and dig deeper, which is one reason why organizations should ensure that their monitoring is set up for doing just that.
The Preply engineering team reported a similar DNS-related issue in which they saw an unusually high number of 5xx errors being reported by Prometheus.

This triggered an alert to the on-call engineer. When they investigated, they found that CoreDNS-autoscaler was automatically reducing the pod count from 3 to 2 due to a lighter load in the Kubernetes cluster. Some pods were being deleted, but traffic was still being routed to them, which led to errors. While they didn’t find the exact root cause of the issue, they were able to find a workaround by re-running a deployment. CoreDNS-autoscaler was triggered, and the conntrack table was rewritten (conntrack is a Linux kernel feature that optimizes CPU usage). As it turned out, there was a bug in conntrack, which certainly didn’t help. The team then looked at Prometheus metrics and CoreDNS logs to dig deeper and resolve the issue.
Targeted Crypto Attack on a Kubernetes Cluster
Apart from issues internal to the system, some attacks originate from outside of the organization. Crypto attacks are on the rise, and with K8s’ growing popularity, attackers are always looking for loopholes to exploit.
Brian Choy of JWPlayer has written about an incident where their Kubernetes cluster was compromised by an external cryptocurrency miner. Their team noticed that Datalog showed a high load average, and when they dug deeper, they discovered a gcc process running on one of their clusters. They then traced it back to Weave Scope, where the process originated, and discovered that although the process was labeled as gcc, it was making outbound calls to a cryptocurrency miner called Monero. They immediately isolated the affected node and began looking for the root cause. As it turned out, Weave Scope had exposed a load balancer, which enabled anyone to launch a command line on a running container. To gauge the impact of the incident, they looked at the logs of the compromised load balancer. This helped them to pinpoint the exact change that was made to a firewall, and it enabled them to trace the progression from there.

It took the team at JWPlayer several days to finally identify the issue, and they learned the lesson that organizations need to track the right kind of monitoring metrics. Organizations also need to make sure to set up alerts for the right kind of metrics and to keep in mind that setting alerts for the wrong kind of metrics will only lead to delays in incident response. This incident also reinforced the importance of investing in anomaly and intrusion detection.
Conclusion
Although there are many different types of complex incidents that one might encounter when working with Kubernetes, all of the teams mentioned above relied on data to work their way to a resolution. When organizations run Kubernetes clusters in production, they must ensure that they have the right kind of monitoring and logging in place to help them identify and resolve incidents quickly.
It’s time to let data charge

.svg)


